Claude Code — Status Line
1. What you get
A single line that Claude Code renders under the prompt and refreshes every few seconds:
🤖 Sonnet 5.5 │ 📁 tech-docs │ 🌿 main │ 🧠 4% ░░░░░░░░░░ │ 💰 $0.06 │ ⚡ CPU 35% │ RAM 12.2/24.0 GB (51%)This is how it looks in a real Claude Code session, right under the prompt:
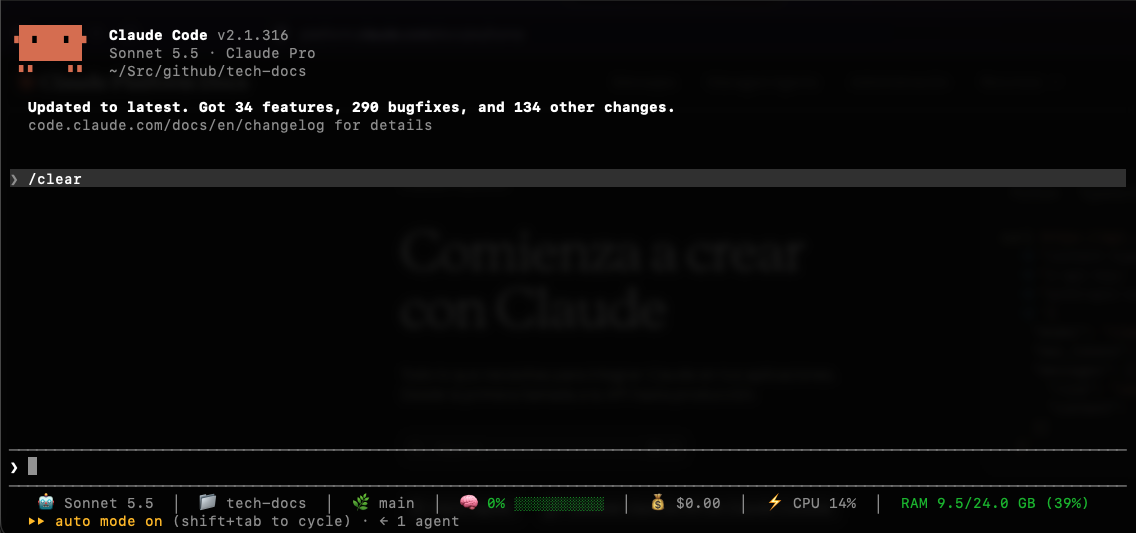
| Segment | Source | Colour rule |
|---|---|---|
| 🤖 Model | model.display_name from the JSON Claude Code sends | — |
| 📁 Project | basename of workspace.current_dir | — |
| 🌿 Branch | git branch --show-current (* when the tree is dirty) | — |
| 🧠 Context | context_window.used_percentage + a 10-cell bar | green < 70 %, yellow ≥ 70 %, red ≥ 90 % |
| 💰 Cost | cost.total_cost_usd | — |
| ⚡ CPU | system user + sys load | — |
| RAM | used / total GB | green < 75 %, yellow ≥ 75 %, red ≥ 90 % |
The first four segments come from Claude Code itself; CPU and RAM are the only OS-specific parts. Use the macOS / Ubuntu tabs on any code block below — the whole page switches.
2. How it works
Claude Code runs the command configured in statusLine on a timer, pipes a JSON document to its stdin, and prints whatever the command writes to stdout (ANSI colours included). That’s the whole contract.
Claude Code ──JSON on stdin──▶ ~/.claude/statusline.sh ──one line on stdout──▶ status barThe script lives in ~/.claude/statusline.sh, so it applies to every project.
3. Install
Requirements — jq (everything else ships with macOS):
brew install jq1. Create the script
mkdir -p ~/.claude
cat > ~/.claude/statusline.sh <<'SCRIPT'
#!/bin/bash
# Claude Code status line — macOS
INPUT=$(cat)
json() { echo "$INPUT" | jq -r "$1" 2>/dev/null; }

# ---- Claude Code data --------------------------------------------------
MODEL=$(json '.model.display_name // .model.id // "Claude"')
CURRENT_DIR=$(json '.workspace.current_dir // .cwd // empty')
[ -z "$CURRENT_DIR" ] && CURRENT_DIR="$PWD"
PROJECT=$(basename "$CURRENT_DIR")

CONTEXT=$(printf "%.0f" "$(json '.context_window.used_percentage // 0')" 2>/dev/null)
[[ "$CONTEXT" =~ ^[0-9]+$ ]] || CONTEXT=0

COST=$(json '.cost.total_cost_usd // 0')
[[ "$COST" =~ ^[0-9]+([.][0-9]+)?$ ]] || COST=0

# ---- Git ---------------------------------------------------------------
GIT=""
if git -C "$CURRENT_DIR" rev-parse --is-inside-work-tree >/dev/null 2>&1; then
  BRANCH=$(git -C "$CURRENT_DIR" branch --show-current 2>/dev/null)
  [ -z "$BRANCH" ] && BRANCH="detached"
  if [ -n "$(git -C "$CURRENT_DIR" status --porcelain 2>/dev/null)" ]; then
    GIT="🌿 ${BRANCH}*"
  else
    GIT="🌿 ${BRANCH}"
  fi
fi

# ---- Context bar + colours --------------------------------------------
RESET="\033[0m"; GREEN="\033[32m"; YELLOW="\033[33m"; RED="\033[31m"

BAR_WIDTH=10
FILLED=$((CONTEXT * BAR_WIDTH / 100))
[ "$FILLED" -gt "$BAR_WIDTH" ] && FILLED=$BAR_WIDTH
CONTEXT_BAR=""
for ((i=0; i<FILLED; i++)); do CONTEXT_BAR="${CONTEXT_BAR}█"; done
for ((i=FILLED; i<BAR_WIDTH; i++)); do CONTEXT_BAR="${CONTEXT_BAR}░"; done

if   [ "$CONTEXT" -ge 90 ]; then CONTEXT_COLOR="$RED"
elif [ "$CONTEXT" -ge 70 ]; then CONTEXT_COLOR="$YELLOW"
else CONTEXT_COLOR="$GREEN"; fi

# ---- CPU (macOS: top) --------------------------------------------------
# user% + sys% = active CPU for the whole machine (not per core).
CPU=$(top -l 1 -n 0 2>/dev/null | awk '/CPU usage:/ {
  for (i=1; i<=NF; i++) {
    if ($i ~ /user/) { gsub("%","",$(i-1)); u=$(i-1) }
    if ($i ~ /sys/)  { gsub("%","",$(i-1)); s=$(i-1) }
  }
  printf "%.0f", u + s
}')
CPU=${CPU:-0}
[ "$CPU" -gt 100 ] && CPU=100

# ---- RAM (macOS: sysctl + vm_stat) ------------------------------------
# used = active + wired + compressed - purgeable - speculative
TOTAL_BYTES=$(sysctl -n hw.memsize 2>/dev/null); TOTAL_BYTES=${TOTAL_BYTES:-0}
VMSTAT=$(vm_stat 2>/dev/null)
PAGE_SIZE=$(echo "$VMSTAT" | head -1 | awk '{print $8}' | tr -d '.'); PAGE_SIZE=${PAGE_SIZE:-4096}
pages() { echo "$VMSTAT" | awk -v k="$1" -v f="$2" '$0 ~ k {gsub("\\.","",$f); print $f}'; }
ACTIVE=$(pages "Pages active" 3);                  ACTIVE=${ACTIVE:-0}
WIRED=$(pages "Pages wired down" 4);               WIRED=${WIRED:-0}
COMPRESSED=$(pages "occupied by compressor" 5);    COMPRESSED=${COMPRESSED:-0}
PURGEABLE=$(pages "Pages purgeable" 3);            PURGEABLE=${PURGEABLE:-0}
SPECULATIVE=$(pages "Pages speculative" 3);        SPECULATIVE=${SPECULATIVE:-0}

USED_PAGES=$((ACTIVE + WIRED + COMPRESSED))
[ "$USED_PAGES" -gt "$PURGEABLE" ]   && USED_PAGES=$((USED_PAGES - PURGEABLE))
[ "$USED_PAGES" -gt "$SPECULATIVE" ] && USED_PAGES=$((USED_PAGES - SPECULATIVE))
USED_BYTES=$((USED_PAGES * PAGE_SIZE))
SCRIPT
The script above stops before the output. Append the shared tail from step 4.
Requirements — jq and git (CPU and RAM come from /proc, so nothing else is needed):
sudo apt update && sudo apt install -y jq git1. Create the script
mkdir -p ~/.claude
cat > ~/.claude/statusline.sh <<'SCRIPT'
#!/bin/bash
# Claude Code status line — Ubuntu / Linux
INPUT=$(cat)
json() { echo "$INPUT" | jq -r "$1" 2>/dev/null; }

# ---- Claude Code data --------------------------------------------------
MODEL=$(json '.model.display_name // .model.id // "Claude"')
CURRENT_DIR=$(json '.workspace.current_dir // .cwd // empty')
[ -z "$CURRENT_DIR" ] && CURRENT_DIR="$PWD"
PROJECT=$(basename "$CURRENT_DIR")

CONTEXT=$(printf "%.0f" "$(json '.context_window.used_percentage // 0')" 2>/dev/null)
[[ "$CONTEXT" =~ ^[0-9]+$ ]] || CONTEXT=0

COST=$(json '.cost.total_cost_usd // 0')
[[ "$COST" =~ ^[0-9]+([.][0-9]+)?$ ]] || COST=0

# ---- Git ---------------------------------------------------------------
GIT=""
if git -C "$CURRENT_DIR" rev-parse --is-inside-work-tree >/dev/null 2>&1; then
  BRANCH=$(git -C "$CURRENT_DIR" branch --show-current 2>/dev/null)
  [ -z "$BRANCH" ] && BRANCH="detached"
  if [ -n "$(git -C "$CURRENT_DIR" status --porcelain 2>/dev/null)" ]; then
    GIT="🌿 ${BRANCH}*"
  else
    GIT="🌿 ${BRANCH}"
  fi
fi

# ---- Context bar + colours --------------------------------------------
RESET="\033[0m"; GREEN="\033[32m"; YELLOW="\033[33m"; RED="\033[31m"

BAR_WIDTH=10
FILLED=$((CONTEXT * BAR_WIDTH / 100))
[ "$FILLED" -gt "$BAR_WIDTH" ] && FILLED=$BAR_WIDTH
CONTEXT_BAR=""
for ((i=0; i<FILLED; i++)); do CONTEXT_BAR="${CONTEXT_BAR}█"; done
for ((i=FILLED; i<BAR_WIDTH; i++)); do CONTEXT_BAR="${CONTEXT_BAR}░"; done

if   [ "$CONTEXT" -ge 90 ]; then CONTEXT_COLOR="$RED"
elif [ "$CONTEXT" -ge 70 ]; then CONTEXT_COLOR="$YELLOW"
else CONTEXT_COLOR="$GREEN"; fi

# ---- CPU (Linux: /proc/stat) ------------------------------------------
# /proc/stat holds counters since boot, so take two samples 0.3 s apart
# and compute the busy share of the delta.
read -r _ u1 n1 s1 i1 w1 q1 sq1 _ < /proc/stat
sleep 0.3
read -r _ u2 n2 s2 i2 w2 q2 sq2 _ < /proc/stat
IDLE=$(( (i2 + w2) - (i1 + w1) ))
TOTAL=$(( (u2 + n2 + s2 + i2 + w2 + q2 + sq2) - (u1 + n1 + s1 + i1 + w1 + q1 + sq1) ))
if [ "$TOTAL" -gt 0 ]; then CPU=$(( (TOTAL - IDLE) * 100 / TOTAL )); else CPU=0; fi

# ---- RAM (Linux: /proc/meminfo) ---------------------------------------
# used = MemTotal - MemAvailable (the same figure `free` reports as "used").
TOTAL_KB=$(awk '/^MemTotal:/ {print $2}' /proc/meminfo);     TOTAL_KB=${TOTAL_KB:-0}
AVAIL_KB=$(awk '/^MemAvailable:/ {print $2}' /proc/meminfo); AVAIL_KB=${AVAIL_KB:-0}
TOTAL_BYTES=$((TOTAL_KB * 1024))
USED_BYTES=$(( (TOTAL_KB - AVAIL_KB) * 1024 ))
SCRIPT
The script above stops before the output. Append the shared tail from step 4.
4. Shared output block
Both variants end with the same code: convert bytes to GB, colour the RAM figure, and print the line. Append it to the file you just created:
cat >> ~/.claude/statusline.sh <<'SCRIPT'

# ---- RAM formatting ----------------------------------------------------
RAM_TOTAL=$(awk -v b="$TOTAL_BYTES" 'BEGIN {printf "%.1f", b/1024/1024/1024}')
RAM_USED=$(awk  -v b="$USED_BYTES"  'BEGIN {printf "%.1f", b/1024/1024/1024}')
if [ "$TOTAL_BYTES" -gt 0 ]; then
  RAM_PERCENT=$(awk -v u="$USED_BYTES" -v t="$TOTAL_BYTES" 'BEGIN {printf "%.0f", u/t*100}')
else
  RAM_PERCENT=0
fi

if   [ "$RAM_PERCENT" -ge 90 ]; then RAM_COLOR="$RED"
elif [ "$RAM_PERCENT" -ge 75 ]; then RAM_COLOR="$YELLOW"
else RAM_COLOR="$GREEN"; fi

# ---- Output ------------------------------------------------------------
printf "%b🤖 %s%b  │  📁 %s  │  %s  │  %b🧠 %s%% %s%b  │  💰 \$%.2f  │  ⚡ CPU %s%%  │  %bRAM %s/%s GB (%s%%)%b\n" \
  "$RESET" "$MODEL" "$RESET" "$PROJECT" "$GIT" \
  "$CONTEXT_COLOR" "$CONTEXT" "$CONTEXT_BAR" "$RESET" \
  "$COST" "$CPU" "$RAM_COLOR" "$RAM_USED" "$RAM_TOTAL" "$RAM_PERCENT" "$RESET"
SCRIPT
chmod +x ~/.claude/statusline.sh
5. Register it in Claude Code
Add the statusLine entry to ~/.claude/settings.json (create the file if it doesn’t exist; keep any keys already there):
{
  "statusLine": {
    "type": "command",
    "command": "~/.claude/statusline.sh",
    "padding": 1,
    "refreshInterval": 5
  }
}| Key | Meaning |
|---|---|
command | Script to run. ~ is expanded. |
padding | Horizontal padding of the bar, in characters. |
refreshInterval | Seconds between refreshes, on top of the refresh after each message. |
Restart Claude Code (or open a new session) to see it.
6. Test it without Claude Code
Feed the script a fake payload — if it prints a coloured line, the setup is right:
echo '{"model":{"display_name":"Sonnet 5.5"},"workspace":{"current_dir":"'"$PWD"'"},"context_window":{"used_percentage":42},"cost":{"total_cost_usd":0.06}}' \
  | ~/.claude/statusline.sh
7. Troubleshooting
| Symptom | Cause / fix |
|---|---|
| Nothing appears | Script not executable (chmod +x) or jq missing (brew install jq). |
CPU 0% always | top output changed; run top -l 1 -n 0 | grep "CPU usage" and check the user / sys fields. |
| RAM looks higher than Activity Monitor | The formula counts active + wired + compressed pages; Activity Monitor’s “Memory Used” also subtracts cached files. Adjust USED_PAGES if you prefer that figure. |
| Bar feels slow | top takes a moment; raise refreshInterval. |
| Symptom | Cause / fix |
|---|---|
| Nothing appears | Script not executable (chmod +x) or jq missing (sudo apt install jq). |
| Emoji show as boxes | Install an emoji font: sudo apt install fonts-noto-color-emoji, then restart the terminal. |
CPU 0% always | /proc/stat unreadable (rare, e.g. restricted containers). Check head -1 /proc/stat. |
RAM differs from htop | This script reports MemTotal − MemAvailable, which is what free -h shows as used; htop may discount buffers differently. |
| Running inside WSL | Works as-is; /proc/meminfo reflects the WSL VM’s memory, not Windows’. |
Common to both: if the line looks garbled, your terminal needs a UTF-8 locale and a font with box-drawing glyphs (JetBrains Mono works well — see the Ghostty guide).